In this most basic way of using anthropometric data one body dimension at a time is taken into consideration to determine product dimensions.
In certain occasions the dimensioning of a product can be determined by looking at one body measurement at a time. In this way very simple design problems can be solved in a relatively easy and fast way because only the mean and standard deviation of a body dimension of the target group are needed.
Sources that were traditionally used for this first occurring type of anthropometry where the standard Ergonomics - Human body dimensions (DIN 33402), measurements on USA Flying Personnel from 1954, online databases like ERGODATA or Anthrokids and off line databases like People Size, Childata or Olderadult.
To create a more reliable source when working for the Dutch population the DINED project was started. DINED is an estimation of 27 body dimension of Dutch adults, which is used as a national standard since 1986.
Advantages
- Relative easy and fast
- Requires only mean and standard deviation from the original dataset (assuming that the source and target population are normal distributed)
Disadvantages
- Lack of information about relations between body dimensions can still lead to unusable product dimensioning and unusable situations.
How to use one-dimensional data
The frequency distribution of a body dimension (if just related to one bone) is generally normally distributed. Exceptions are body weight, waist circumference and other fat related dimensions. Due to this fact statistic calculations give a good insight on the differences in a user population.
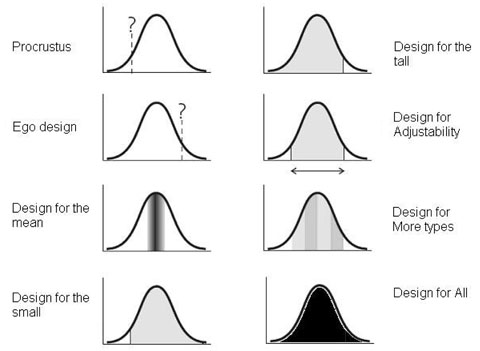
To use one-dimensional data the relation between body and product dimensions has to be determined, possibly with taking into account extra margins for i.e. clothing. Mean and standard deviation, calculated from a population that is comparable to the target group of your design, one of the seven available design types (a tailoring, see picture Dirken) can then be used to find an optimal solution: the design guideline.
Example
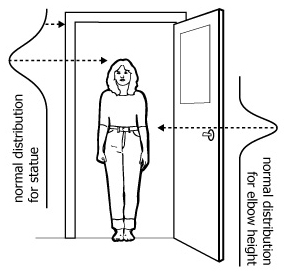
As an example we take a door (see figure). If we would like to determine the height of it we use the normal distribution for statue and pick a value somewhere at the high end. We could for instance include 99% of the target population to make sure that almost everyone can pass the door without bending. This is quite a save decision, as smaller people wont be bothered by a door that is too high.
These three design types: higher, average and variants are three of the in total seven ways in which anthropometric data can be used in design.
Additional resources
See More sources for related resources.