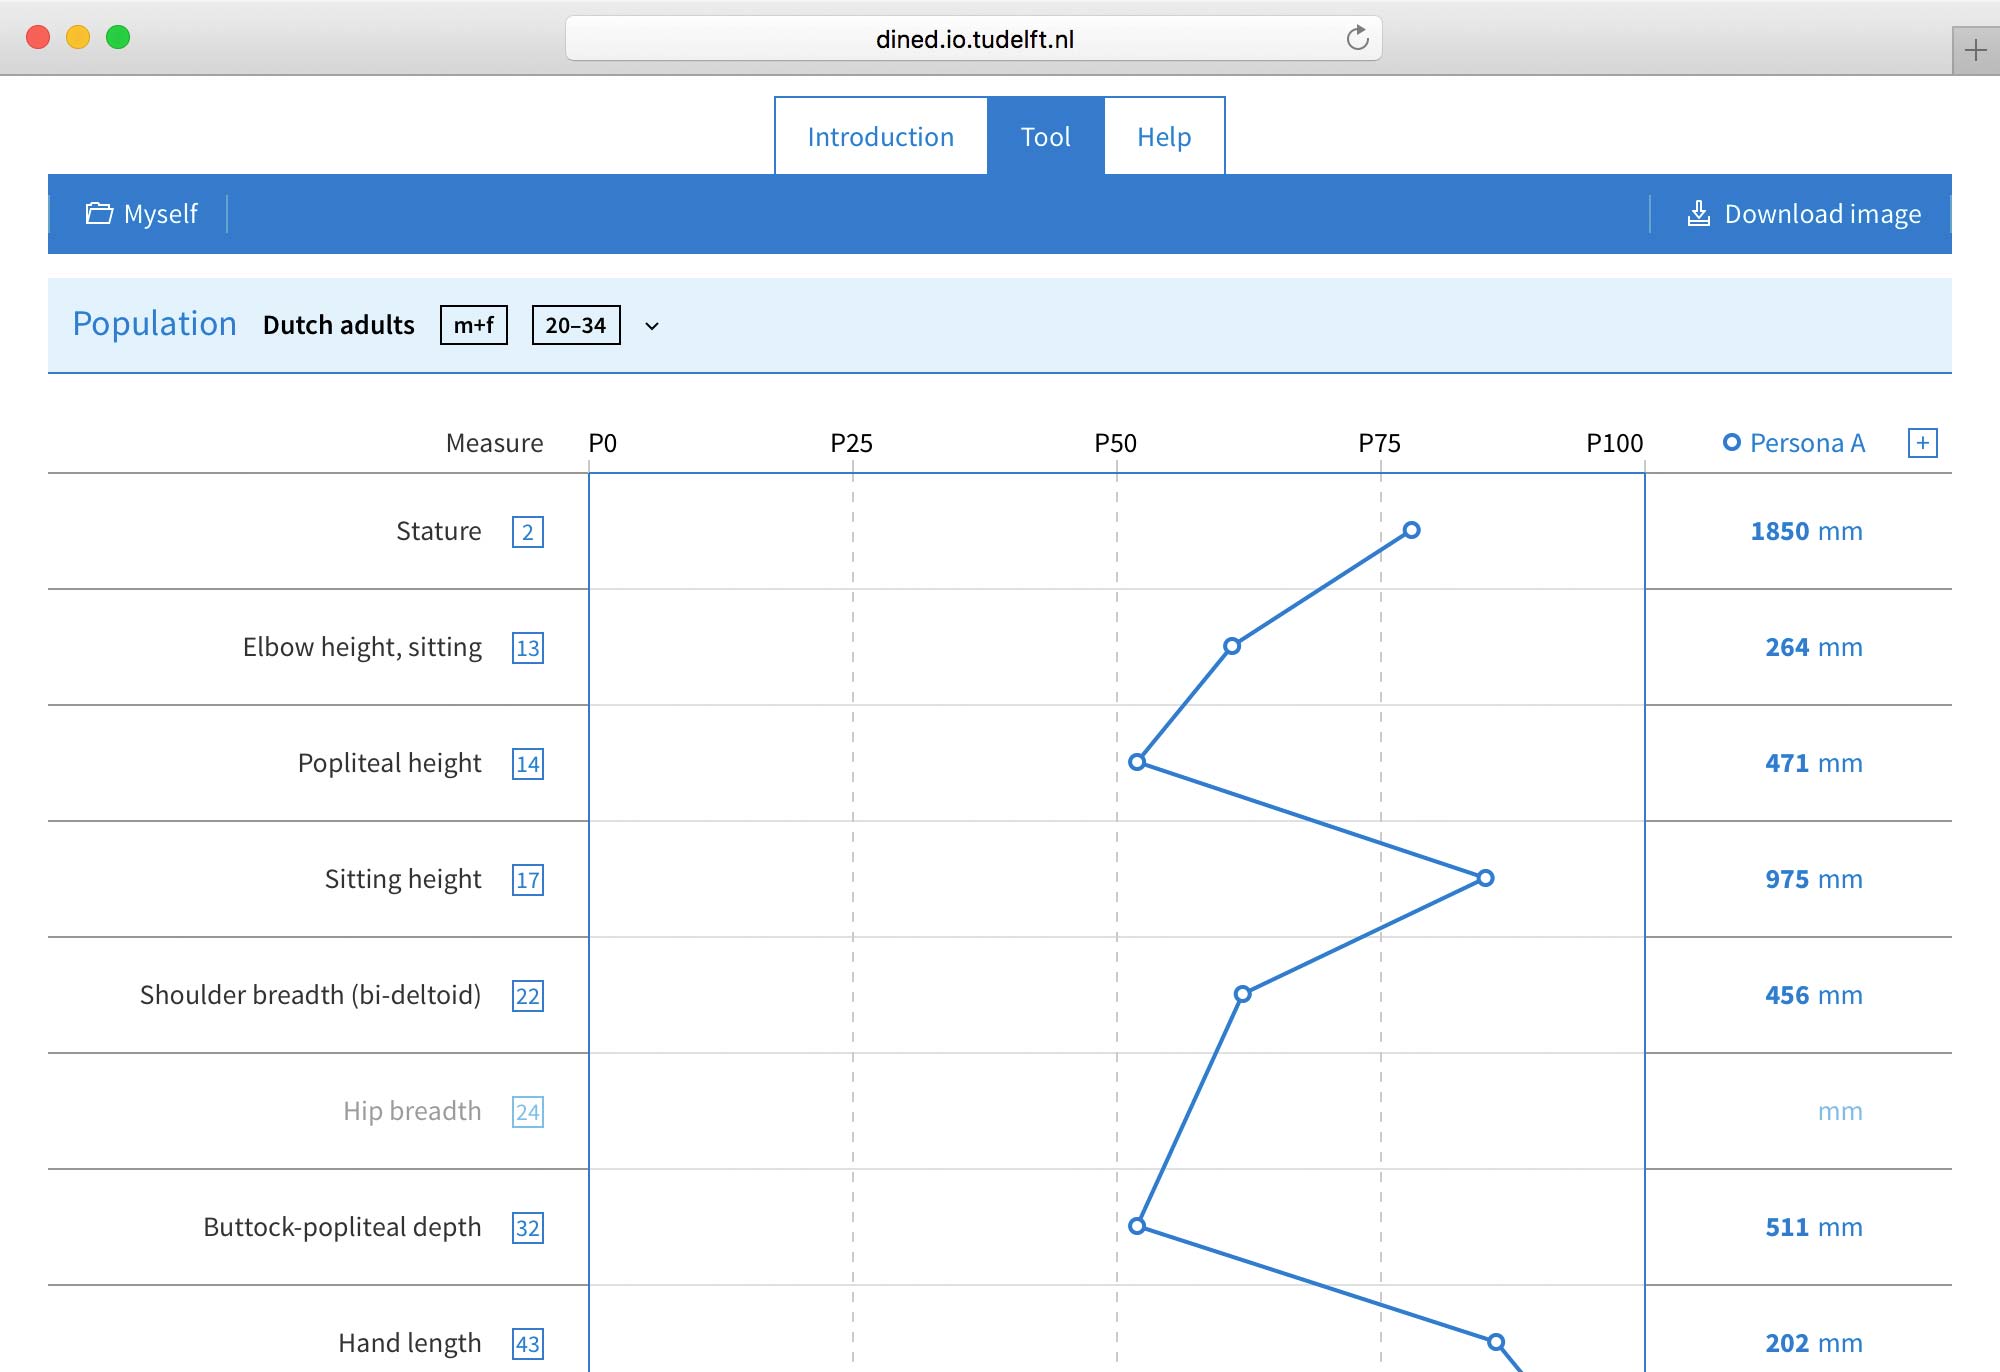
Selecting a population
Using Profiler starts by selecting a population.
Selecting a population
Selecting a study
- In the "Population" panel below the toolbar, click the currently selected population or "Select a population".
- Select a study that represents the right population by clicking one in the list.
Note: Studies approximate the population they represent using a sample. Various factors including sample size, age distribution and sex ratio may affect the validity of results.
Note: Populations with a lock icon next to their name are locked. To use these populations you need to sign in or create a free account.
Filtering a population by sex
- In the "Population" panel below the toolbar, click the currently selected population or "Select a population".
- Select either "male" or "female" to limit the population to either sex or select "mixed" to include both male and female individuals.
Note: Data for mixed populations assumes an equal distribution between male and female individuals (unless the study uses a different distribution). This may not be the population's true ratio of men and women.
Filtering a population by age
- In the "Population" panel below the toolbar, click the currently selected population or "Select a population".
- Do any of the following:
- Select an age group.
- If the population supports custom age groups, use the range slider to select a custom age range.
Selecting measures
Changing a measure
- Click the name of the measure in the table you wish to change.
- Click any of the measure groups in the right column to view the available measures.
- Select a measure by clicking one in the graphic or in the list. Measures available for the selected population have a blue border. Note: Not all measures might be shown in the graphic. Additional measures are shown in a list below the graphic.
Note: Measures with a lock icon instead of a number or with a lock icon next to their name are locked. To use these measures you need to sign in or create a free account.
Adding a meaure
- Click "Add measure" in the last row in the table.
- Click any of the measure groups in the right column to view the available measures.
- Select a measure by clicking one in the graphic or in the list. Measures available for the selected population have a blue border. Note: Not all measures might be shown in the graphic. Additional measures are shown in a list below the graphic.
Removing a measure
- Click the name of the measure in the table you wish to remove.
- Click the - button.
Looking up background information on populations
- In the "Population" panel below the toolbar, click the currently selected population or "Select a population".
- Information on the currently selected population is displayed below the list or graphic. To view information on another population, hover the pointer over that population.
Looking up background information on populations and measures
- In the "Population" section of the sidebar or the "Measures" column in the table, click any selected population or measure.
- Information on the currently selected measure or population is displayed next to the list or graphic. To view information on another population or measure, hover the pointer over that population or measure.
Undoing and redoing changes
- Press the Control + Z keys (Command + Z on macOS) to undo any changes.
- Press the Control + Y keys (Command + Shift + Z on macOS) to redo any changes that have been undone.
Note: You can undo any changes you make to your analysis. This includes changes to measurement values as well as the personas, population and measures.
